Nice OpenEdge DB charts with Docker + InfluxDB + Grafana
As part of a migration project, I wanted to be able to monitor a few database statistics in a quick way, but also be able to provide nice and useful charts without having to rely on a huge analytics layer. A quick Google search later (oh, that wasn't so quick as I lost a lot of time reading various blogs and websites completely unrelated to the topic !), Grafana was the tool I was looking for (at least on the paper^Hscreen). As advertised on their website, Grafana is "The leading graph and dashboard builder for visualizing time series metrics". I couldn't be wrong...
Step 0: install Docker
Docker is a kind of lightweight virtualization technology, where you can run multiple applications independently in containers, without having to virtualize the entire operating system. Looking for a new Tomcat instance ? Just install Docker from your favorite package manager ('yum install docker' for example), then execute the image with 'docker run -p 8888:8080 tomcat:8.0'. In a few seconds, you'll have a new Tomcat 8 container running, and you'll be able to access http://localhost:8888. Need another one ? Execute 'docker run -p 8889:8080 tomcat:8.0'. A few seconds later, another Tomcat 8 instance will be up and running, accessible from http://localhost:8889.
So why Docker here ? InfluxDB and Grafana are based on languages I'm not used to, and I didn't want to spend time pushing various knobs and triggers to make them work. By using pre-configured images, I knew it would work out of the box, and I would just have to redirect a few ports
Step 1: install InfluxDB
If you're an OpenEdge Management user, you probably know that the trend database stores metrics. Same story here, we'll have to store a lot of metrics, but why bother installing a full RDBMS system ? While I find OpenEdge extremely powerful, there's no one size fits all. And when it comes to time-series data, InfluxDB is extremely powerful !
Using Docker, starting a new InfluxDB instance is :
docker run -d -p 8083:8083 -p 8086:8086 --name influxdb tutum/influxdb
Now, just verify that you can connect to http://localhost:8083, and create a new database with 'CREATE DATABASE foo'
Step 2: install Grafana
Grafana is the Web layer which fetch data from InfluxDB, and display them as gorgeous charts
Using Docker, it's still easy:
docker run -d -p 3000:3000 --link influxdb:influxdb --name grafana grafana/grafana
The --link switch let Docker know that those two containers will be able to see each other. You can now verify that you can connect to http://localhost:3000
Step 3: collect OpenEdge metrics
George Potemkin published some time ago a set of procedures to collect metrics from OpenEdge databases. With a few lines of code, I've been able to change the output (the OpenEdge EXPORT statement) to something which can be read by InfluxDB.
You can find those updated procedures on GitHub
If you know how to start an OpenEdge session, it won't be difficult the collect metrics. Just define the PROPATH variable to point at the proceures, execute _progres connected to the set of DB you want to monitor, and execute DbStatDump.p with '-param /path/to/snapshot.d'. This file will store a snapshot of the latest values, so that the next execution will compute the difference. In short, if you trigger the statistics every five minutes, the generated metrics will only show what happened during the last five minutes.
The working directory will now contain a set of *.txt files you'll have to send to InfluxDB. This part is extremely easy as InfluxDB can be fed using a REST interface ; in my case, I'm just using curl this way :
find /path/to/stats -name "*.txt" -print | while read filename ; do /usr/local/bin/curl -X POST -i --data-binary @${filename} "http://localhost:8086/write?db=foo" && rm ${filename} ; doneStep 4: enjoy nice charts !
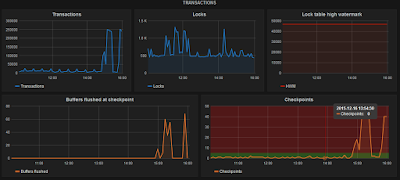
Once data are flowing in the DB, you can starting designing charts, and that's the really easy part. An example for the query editor of the main buffer pool reads :A few screenshots
A few more facts
- In order to use the latest InfluxDB version, I had to regenerate the Docker image. Quite easy to do by editing the Dockerfile at https://github.com/tutumcloud/influxdb. EDIT : this has been fixed in the main GitHub repository.
- Same problem for Grafana, the Docker image wasn't up to date. Regenerating the image was also really easy, just had to change the version number in the Dockerfile.
- InfluxDB and Grafana were installed on an EC2 instance, behind a reverse proxy. A riverside-software.fr subdomain was used to redirect the calls to the Docker instance, without any problem
- The statistics are collected on an HP-UX 11.31 box, running OpenEdge 11.3. Twelve databases are monitored, with around 400 concurrent sessions, and the biggest DB is around 170 Gb, with 350 tables and 1200 indexes
- Statistics are triggered from a remote Jenkins server, every 5 minutes, as sending metrics require an Internet connection. This Jenkins server is also running on HP-UX, and depothelper has been used to install curl. It takes approximately 5 to 6 seconds to fetch statistics from the 12 databases.
- Retention policy can be defined in InfluxDB, especially useful if you don't want to keep your data for a long time, and if you don't want to manually clean data (compact job anymore ? :-) )
- Don't expect Grafana to display any kind of chart. Grafana displays time-based series, so no piechart for example (although such a serie could be represented as a piechart, it's still not possible).
- Have fun !


December 28, 2022 at 2:34 PM
Hi,
Thank you for this article, it's been very helpful!
I have managed to connect Grafana to InfluxDB, but I am having some trouble running the queries.
Would it be possible for you to share your Grafana Dashboard?
Thank you in advance!
Best regards,
Alex M.